



Population Intelligence
for Market Decisions.

330 million synthetic residents, each placed in a real census tract, each carrying the demographic, housing, health, and economic characteristics that decide who buys, where, and when. No personal data. 98% correlation with the real U.S. population.

See how it works
  • 330M synthetic residents
  • ·84,000+ census tracts, 2x ZIP resolution
  • ·9,415 hidden variables
  • ·R² 0.98 vs. Census benchmarks
  • ·No PII
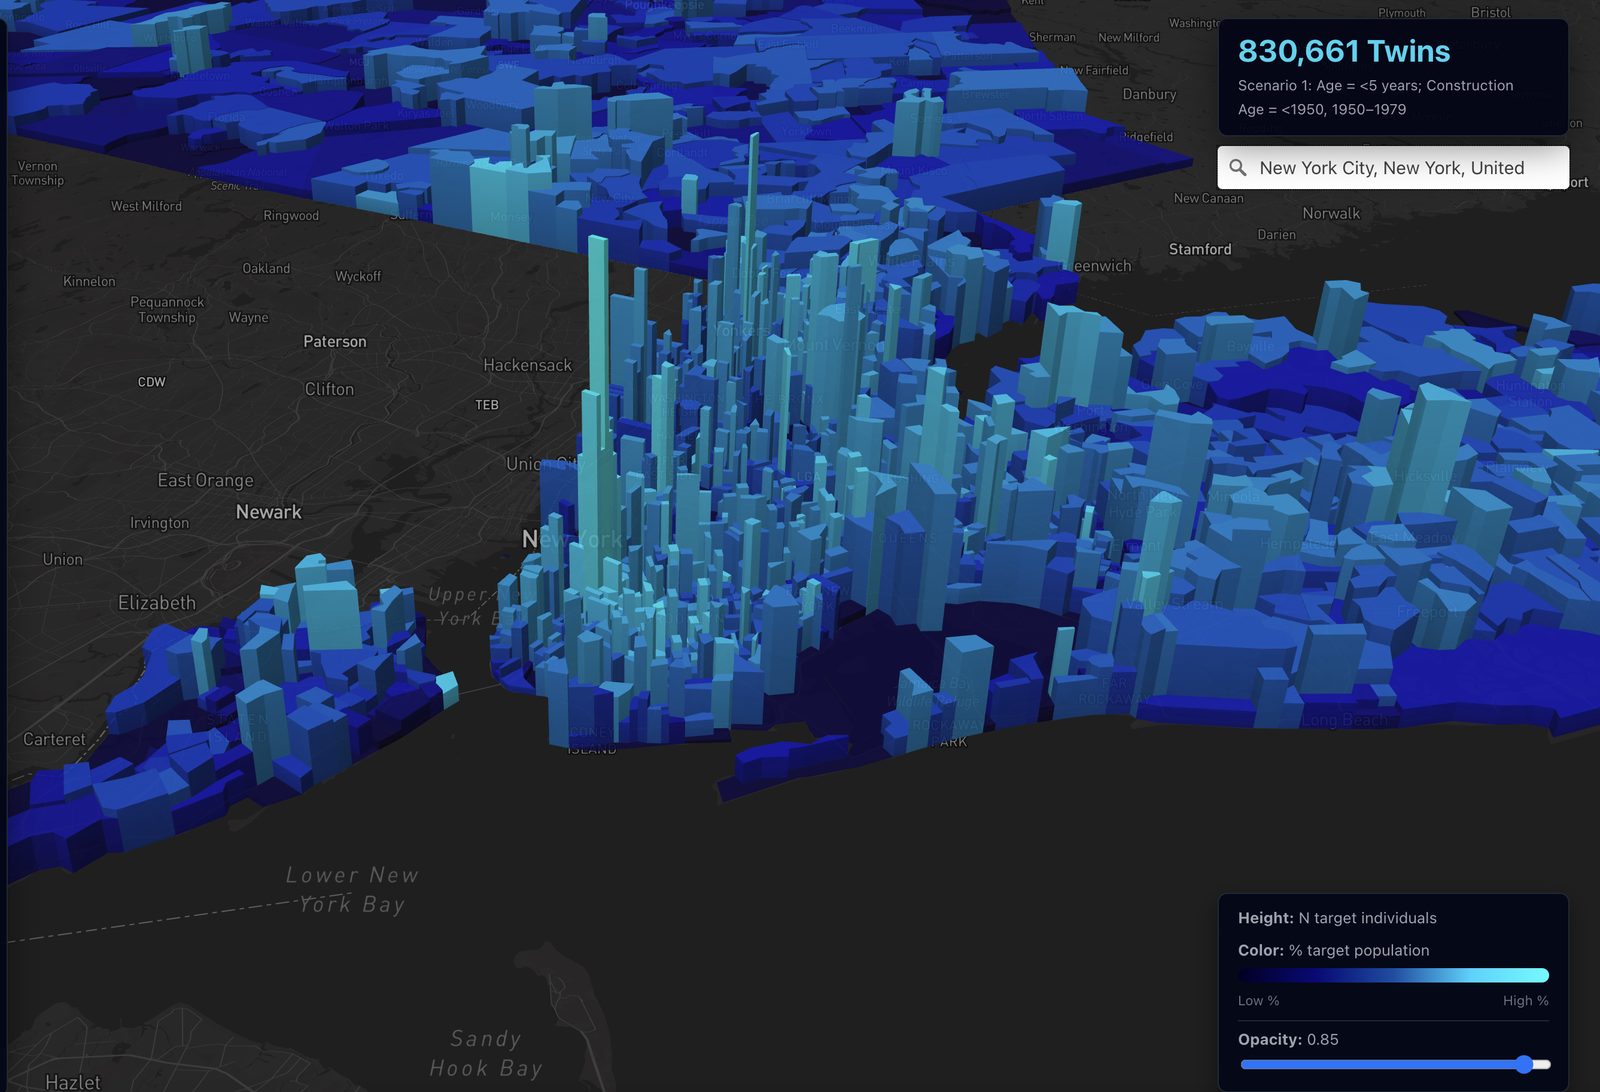
Twin map of New York City showing 830,661 matching synthetic residents as extruded census tracts

Born from Harvard research.
Built using Harvard's supercomputers.

The Twin architecture was engineered at Harvard University over two years on Harvard's high-performance computing clusters, and is licensed by its co-inventors through 9 Foundations. It preserves how characteristics co-occur within a person, at a geographic resolution precise enough for action and stable enough to stay accurate over time.

PII-safe

Detailed people, or detailed geography?
Twin does both.

Privacy rules make every population dataset you can buy pick one. Individual-level data shows how characteristics interact within a person, but it is released only at coarse geography. Neighborhood data is precise about place, but reports one characteristic at a time, averaged across everyone. So decisions get made on incomplete data, and budget gets spread across markets that are not equally valuable.

Neighborhood averages

Safe but vague. "Average income in ZIP 10001." One characteristic at a time, averaged across everyone who lives there.

PII lists

Specific but risky. Heavy regulation, incomplete coverage, privacy liability. And a list still only knows what is on the list.

How Twin does both.

330 million synthetic residents, each modeled as a whole person, each placed in a real census tract. The patterns are real. The people don't exist.

Why Twin exists

We first built Twin to find children at risk of lead exposure.
The standard method missed 73% of them.

Twin began in a Harvard lab as a public-health question: which children are at risk of lead exposure? Risk concentrates where two things overlap, young children and pre-1980 housing. The standard approach takes the top quartile for each characteristic separately and calls the overlap high-risk. Twin models both characteristics jointly inside each synthetic resident, then places that resident in a real census tract.

Across the U.S., the standard approach missed 73% of high-risk tracts: 3.28 million at-risk children, overlooked. That is when we understood what the method could find for anyone.

The same method now finds customers. Who are you missing in your market?

Standard approach
Age <5
Construction age <1980

Take the top quartile for each characteristic separately. Call the overlap high-risk.

Twin approach
Age <5Construction age <1980

Model every characteristic jointly inside each synthetic resident, then place that resident in a real tract.

3.28M

at-risk children the standard method missed nationwide.

The map at the top of this page is this archetype in New York City: 830,661 children, placed tract by tract.

Run by the people
who invented it.

Joseph Allen, DSc, MPH, CIH

Joseph Allen, DSc, MPH, CIH

Professor, Harvard University · CEO and Founder, 9 Foundations

Co-inventor of the Twin architecture, originally built in his Harvard lab. Author of Healthy Buildings and 100+ peer-reviewed papers, regular contributor to Harvard Business Review, and advisor to senior executives at JPMorgan Chase and Amazon.

Shivani Cott, PhD

Shivani Cott, PhD

PhD, Harvard University · Senior Scientist, 9 Foundations

Co-inventor of Twin and its computational core, originating in her doctoral research at Harvard on spatial microsimulation, statistics, and machine learning. She built the statistical logic that lets synthetic residents mirror real populations at tract resolution.

Lauren Ferguson, PhD

Lauren Ferguson, PhD

PhD, University College London · Senior Scientist, 9 Foundations

Co-inventor. Quantitative methods, building simulation, and synthetic population generation. Built national-scale residential models of the U.S. and U.K.

Emily Jones, PhD

Emily Jones, PhD

PhD, Harvard University · MSE, Princeton University · Chief Science Officer, 9 Foundations

Environmental modeling and analytics. Leads the Advanced Analytics team and advises Fortune 500 companies on environmental health; upholds the technical standards Twin's partners require.

Three questions.
One answer.

01

Who are my customers?

Persona identification

Work backwards from limited sales or engagement data to infer the customer profile most associated with strong performance. Not just by age and income: insurance type, disability status, language spoken at home.

02

Where do they live?

Precision & growth market analysis

Find where that profile is concentrated, in the markets you already serve and in the ones you are weighing entering.

03

When will they respond?

Demand trigger responsiveness

Overlay weather, environment, and your own locations on the same tracts, so activation is timed to when demand is projected to move.

Twin provides an integrated answer

Where are the customers who want what this product does — and when?

Ten base variables in every Twin.
Thousands of hidden variables layered on as the question requires.

The base · every Twin carries these ten
  • Age
  • Sex
  • Race
  • Ethnicity
  • Household income
  • Household size
  • Housing tenure
  • Building type
  • Construction age
  • Heating fuel
The hidden variables · 9 domains · 9,415 hidden variables

People & Households

Who people are, how households are composed, and where they came from.

3 packs · 586 hidden variables

Education, Work & Economic Life

Schooling, occupation, income, and economic position.

3 packs · 1,575 hidden variables

Consumer & Financial Life

Spending, banking, credit, assets, and financial resilience.

6 packs · 1,584 hidden variables

Health & Care

Coverage, care use, conditions, function, and prevention.

13 packs · 2,547 hidden variables

Behaviors & Daily Living

Activity, consumption, sleep, food, caregiving, and family life.

8 packs · 447 hidden variables

Housing & Property

The structure, its systems, its condition, and what it costs.

9 packs · 1,316 hidden variables

Energy & Utilities

Equipment, fuels, consumption, cost, and energy burden.

9 packs · 490 hidden variables

Mobility, Place & Connectivity

How people move, what they drive, and where they are connected.

7 packs · 848 hidden variables

Safety & Risk

Community safety context.

3 packs · 22 hidden variables

The hidden variables are the characteristics that separate your customer from everyone else: the ones neighborhood averages can't see and lists don't carry. What kind of insurance they carry. Whether someone in the home has a disability. What language is spoken at home. Twin carries 9,415 of them.

Precision
Targeting.

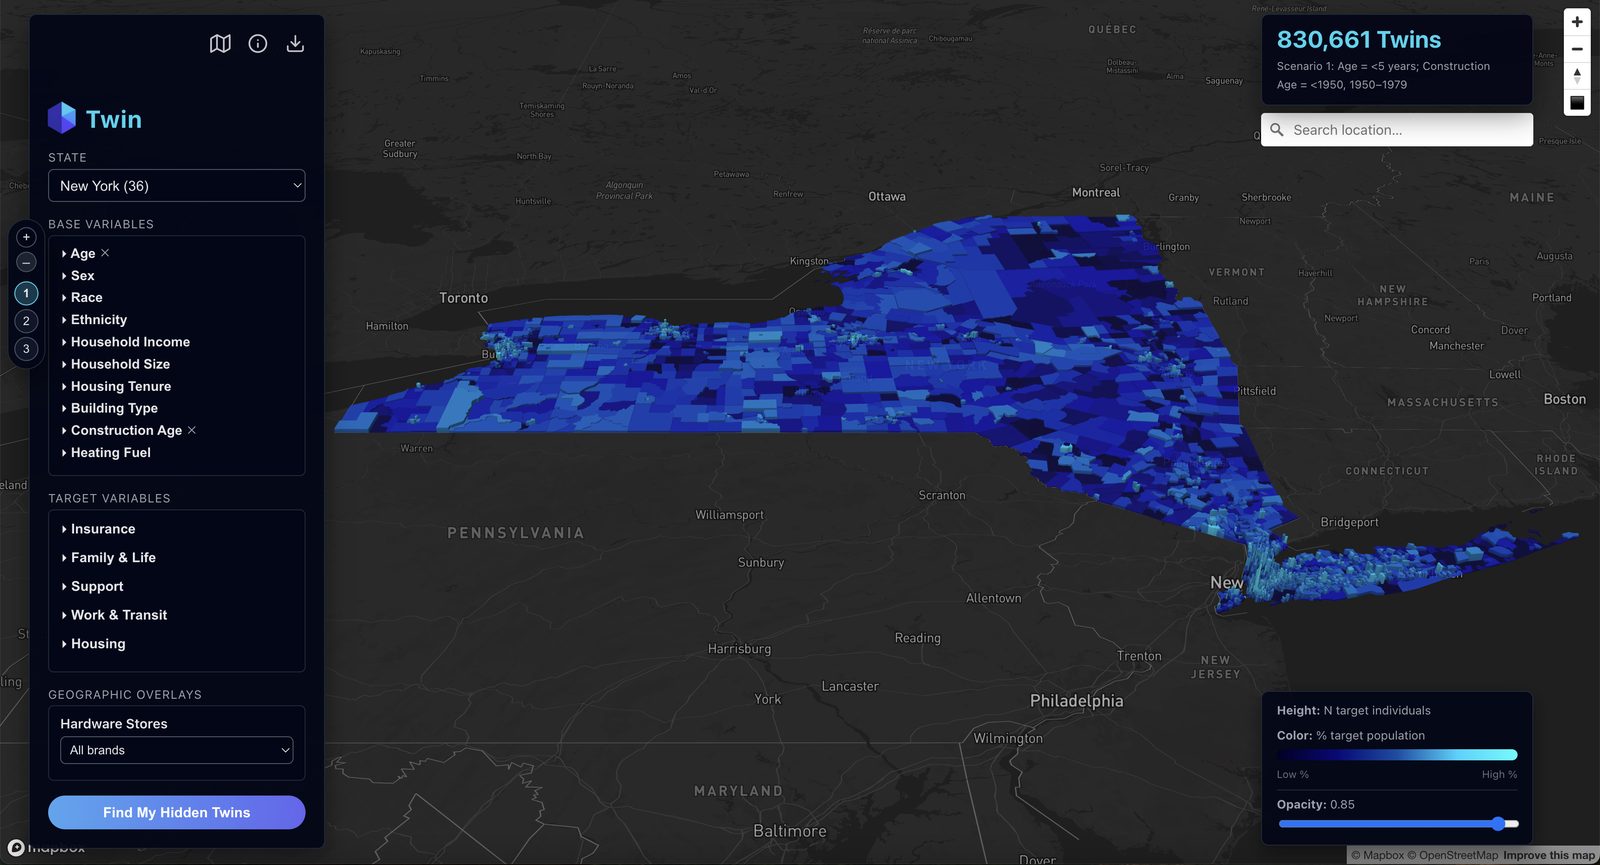
Choose a geography. Define the customer. Add the hidden variables and the spatial context. Twin shows where they are, tract by tract, and when.

830,661
matching Twins
Twin platform view of New York State with matching census tracts highlighted
Twin perspective map of New York City

Validated against
the real U.S. population.

Gold-standard data only

Federal surveys and the decennial census.

No PII

Synthetic residents, not records. Nothing to breach, nothing to consent, nothing to de-identify.

Tract-level resolution

84,000+ census tracts, about twice the resolution of ZIP codes.

98% correlation

Average Pearson R² of 0.98 across all census tracts. Kullback–Leibler divergence below 0.08 for every variable tested.

Five questions Twin has answered.
In market.

Read all five in full
Retail

Ranking every grocer in the state by the customers it can reach.

A national packaged-foods manufacturer needed to rank grocers across Michigan to decide where to invest marketing, messaging, and logistics. The available methods ranked stores by household income or by total population, and neither captured the segment they were trying to reach.

Hidden variables
  • Household composition
  • SNAP participation
Read the case study
Building products

Finding homes that can take the product, and owners ready to buy it.

A roof window manufacturer entering the U.S. market needed to know which homes its product can physically go into, and which owners are close to a renovation decision. Household income and home value answer neither question.

Hidden variables
  • Attic present and whether finished
  • Roof material
Read the case study
Health insurance

Turning five member families into eighteen mappable archetypes.

A regional health insurer needed personas for its priority member groups to guide communications, media, and product development. The research available was quantitative and third-party; neither showed where those members live or how their local environment shapes their care.

Hidden variables
  • Language spoken at home
  • Caregiving hours
Read the case study
Home mobility

Narrowing 5,000 mailers down to the tracts worth mailing.

A home mobility company wanted to test whether a 5,000-piece direct-mail pilot across Massachusetts could complement its digital lead generation. Available lists were built on age and homeownership alone, which do not capture the combination of conditions that drives the purchase.

Hidden variables
  • Ambulatory difficulty
  • Number of stories
Read the case study
Pharmacy delivery

Working backwards from sales to the customer behind each drug.

A prescription delivery company needed to know who was driving demand for each drug across Massachusetts, why some service areas under- or over-performed against their footprint, and how to change operating windows. Sales data showed where orders came from, not who placed them.

Hidden variables
  • Hours at home on weekdays
  • Vehicle availability
Read the case study
Your question

The sixth question is yours.
Tell us what you're deciding.

Select what you need,
then choose how it reaches you.

01 · Make your selections
  1. 01
    An archetype

    the customer you are trying to reach, defined variable by variable.

  2. 02
    Target variable packs

    the hidden variables that separate them from everyone else.

  3. 03
    Geographic overlays

    your locations, third-party points, weather and environment.

  4. 04
    Geographies

    the states, DMAs, or regions the decision actually covers.

  5. 05
    Custom analytic layers

    scoring, ranking, or inference built for your question.

02 · Get your insights
The platform

Build archetypes, see concentration, export priority tracts. Password-protected, issued per user.

The API

Pull Twin outputs into your own environment, your agency's platform, or an activation partner's system.

With us

9 Foundations builds the archetypes, runs the analysis, and delivers a decision-ready report. Most engagements start here.

03 · Put them to work
  • Direct mail
    Residential address list
  • Canvassing & field sales
    Census tract list
  • Geofenced digital
    Tract-to-ZIP list
  • In-store & retail media
    Ranked store and point locations
  • Logistics & operations
    Warehouse siting, rep coverage, operating windows
  • Look-alike expansion
    Tracts that match your best markets
  • Real-time triggers
    Weather and environment alerts on your tracts

Delivered as CSV, Excel, GeoJSON, API feed, or scheduled email alert.

Your next 100,000 customers are
hiding in plain sight.

Or write to twin@9Foundations.com.